Low Risk
Markets are functioning normally with low systemic stress.
Low (0-25)
Elevated (25-45)
High (45-65)
Critical (65+)
What does this mean?
This dashboard aggregates multiple financial stress indicators from the US Federal Reserve (FRED), European Central Bank (ECB), and Office of Financial Research (OFR). A higher score indicates greater systemic stress in financial markets, which may affect investment returns and economic stability.
Key Indicators
| Indicator | Status | |
|---|---|---|
| 🟢 | High Yield Spread | Normal |
| 🟢 | Equity Volatility | Normal |
| 🟠 | Gold Volatility | High |
| 🟢 | ECB CISS Index | Normal |
| 🟢 | OFR Stress Index | Normal |
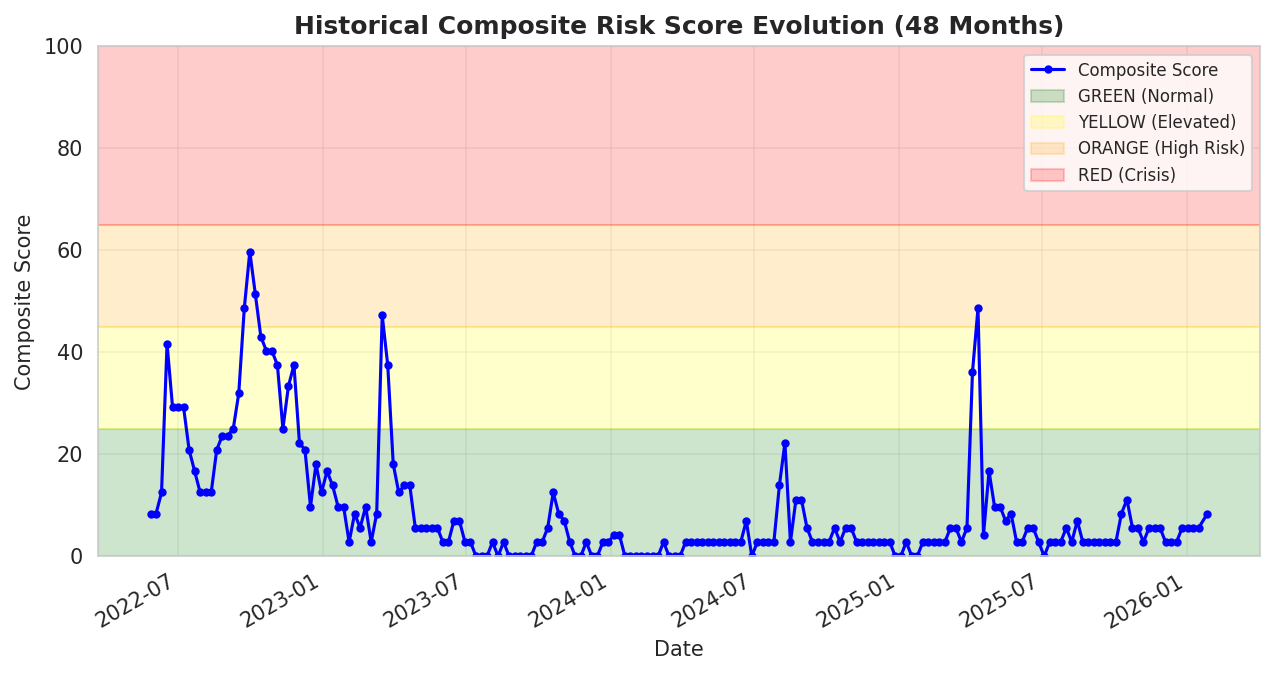
48-Month Trend
Historical evolution of the composite risk score.